 A vision of Britain through time
A vision of Britain from 1801 to now.
Including maps, statistical trends and historical descriptions.
A vision of Britain through time
A vision of Britain from 1801 to now.
Including maps, statistical trends and historical descriptions.

This part of Vision of Britain provides detailed documentation for the system's contents, especially its statistical content. We no longer offer a download facility, except for the GB1900 Gazetteer. Browse "Statistics by topic" to learn how the data have been re-organised for access within Vision of Britain, and "GBHDB" for details of the original transcriptions.
Once you have located statistical datasets of interest in GBHDB, you will usually be able to download them from the UK Data Service under an open copyright license. Our deposits with the UK Data Service are mostly based on the sections listed here within GBHDB, and you can find them in the UKDS Catalogue by searching for "GBHDB".
To download digital copies of historical maps, we recommend the National Library of Scotland online map collection, and we are providing them with copies of map images they do not already hold.
All our digital boundary data are being made available through the UK Data Service except for parish boundaries, again under open licenses but limiting commercial use. These boundary data include the same system of unit identifiers as are systematically included in our updated statistical deposits with the UK Data Service, simplifying statistical mapping.
Commercial licensing of historical parish boundary data is our main source of continuing income, but these boundaries may be made available for non-commercial use by special request: email gbhgis[at]port.ac.uk to find out more.
We continue to make the GB1900 gazetteer freely downloadable.
The GB1900 project computerised all the place names and other text on the Second Edition County Series six-inch-to-one-mile maps covering the whole of Great Britain, published by the Ordnance Survey between 1888 and 1914 -- 1900 for short. We are making the resulting data available for download in three formats: These are all large zip archives which may take some time to download. They each include documentation and a copy of the relevant Creative Commons licence.
This ZIP archive includes four tables holding all final raw data from the crowd-sourcing system except personal information about volunteers, plus detailed documentation.
This dataset of c. 2.55m rows is based on the raw data from the crowd-sourcing system, but includes just one agreed name for each location, which for about 1.5% of the transcriptions involved manual checking after the online project ended. Each entry also includes the location in OSGB and WGS84 coordinates, and the names of the nation, modern local authority and modern parish containing the location.
The complete gazetteer includes very large numbers of repeating labels, such as "F.P." for footpath. This version is substantially reduced in size by removing the commonest such labels, but still contains many transcriptions which are not necessarily place-names.
The Complete and Abridged GB1900 Gazetteers are made available under a Creative Commons Attribution Share Alike Licence, which means that you may do anything you like with these data, including using them commercially, but you must acknowledge the Great Britain Historical GIS, the GB1900 partners and volunteers, and you may not imply that your work is in any sense endorsed by the GB1900 project or its partners. You must provide a link to the licence, indicating if changes were made. You can redistribute the data but only under the same licence and without additional restrictions.
The GB1900 Raw Dump is made available under a Creative Commons CC0 1.0 Universal Licence. This means that you may do anything you like with these data, including using them commercially, and are not required to acknowledge us. However, you may not give the name "GB1900 Gazetteer", or similar, to any resulting work: invent your own. Only unmodified versions of the gazetteer files may be distributed as the "GB1900 Gazetteer".
The project ran from September 2016 to January 2018, and was a collaboration between the GB Historical GIS, the creators of A Vision of Britain through Time, the National Library of Scotland, the Royal Commission on the Ancient and Historical Monuments of Wales, the University of Wales Centre for Advanced Welsh and Celtic Studies, the National Library of Wales and the People’s Collection Wales. We are deeply grateful to the more than a thousand online volunteers who did most of the hard work.
The Vision of Britain system holds a large library of historical statistics. We store all the data values in one big list, and for each value we record:
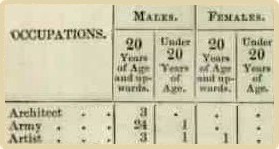
We record WHAT each number measures via our implementation of the Aggregate/Tabular Data Extension developed by the Data Documentation Initiative. This places each data value within a dataset, or nCube, whose dimensions are defined by variables (sometimes organised into variable groups), like occupation and gender and age, each of which is a set of categories, such as "Males" and "Females":
Enter a search term below to find relevant datasets from our statistical database:
Themes are used in the Vision of Britain system to organise all our statistical data into a small number of broad categories, often identified by icons on the web site. Click on one of the Themes for more information:
Most of the material in Vision of Britain has been imported from an older, larger and more traditional system called the Great Britain Historical Database. The more traditional structure means we cannot provide users with direct access to the contents of GBHDB, only this documentation system. Direct access to the contents of GBHDB is available for download via the UK Data Service.


